
This ongoing educational blog series is for freight brokers like you who are moving U.S. and Canadian freight every day of the week! In each blog in this series, we’re providing you with tips and tricks to help you become more efficient in your daily work. This newest blog in the series is dedicated to the Stats tool in Trucker Tools’ Smart Capacity platform. This powerful tool allows you to look at how carriers and drivers are interacting with you and your brokerage via Smart Capacity for a given time period. With this data, you can identify what you’re doing well in the platform, as well as problem areas that might require additional effort or education.
Step #1 — Open Stats
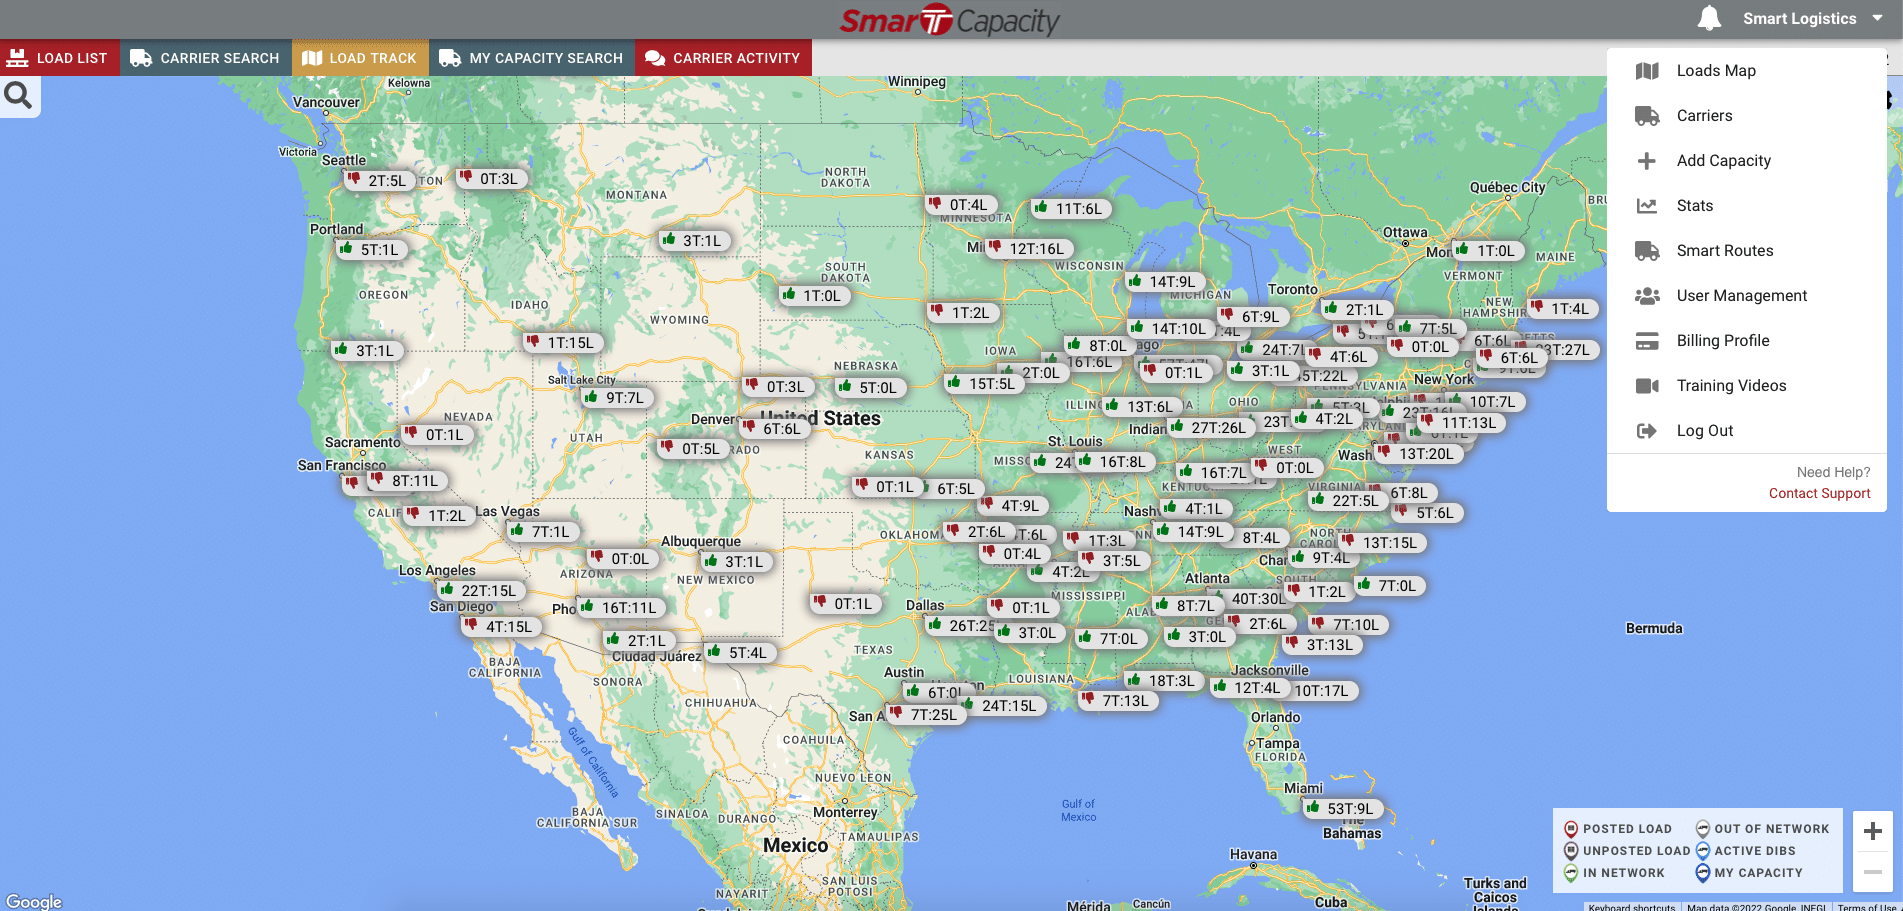
To open Smart Capacity’s Stats, click on Stats in the menu on the top righthand side of your screen underneath your company name.
Step #2 — Choose Date Range
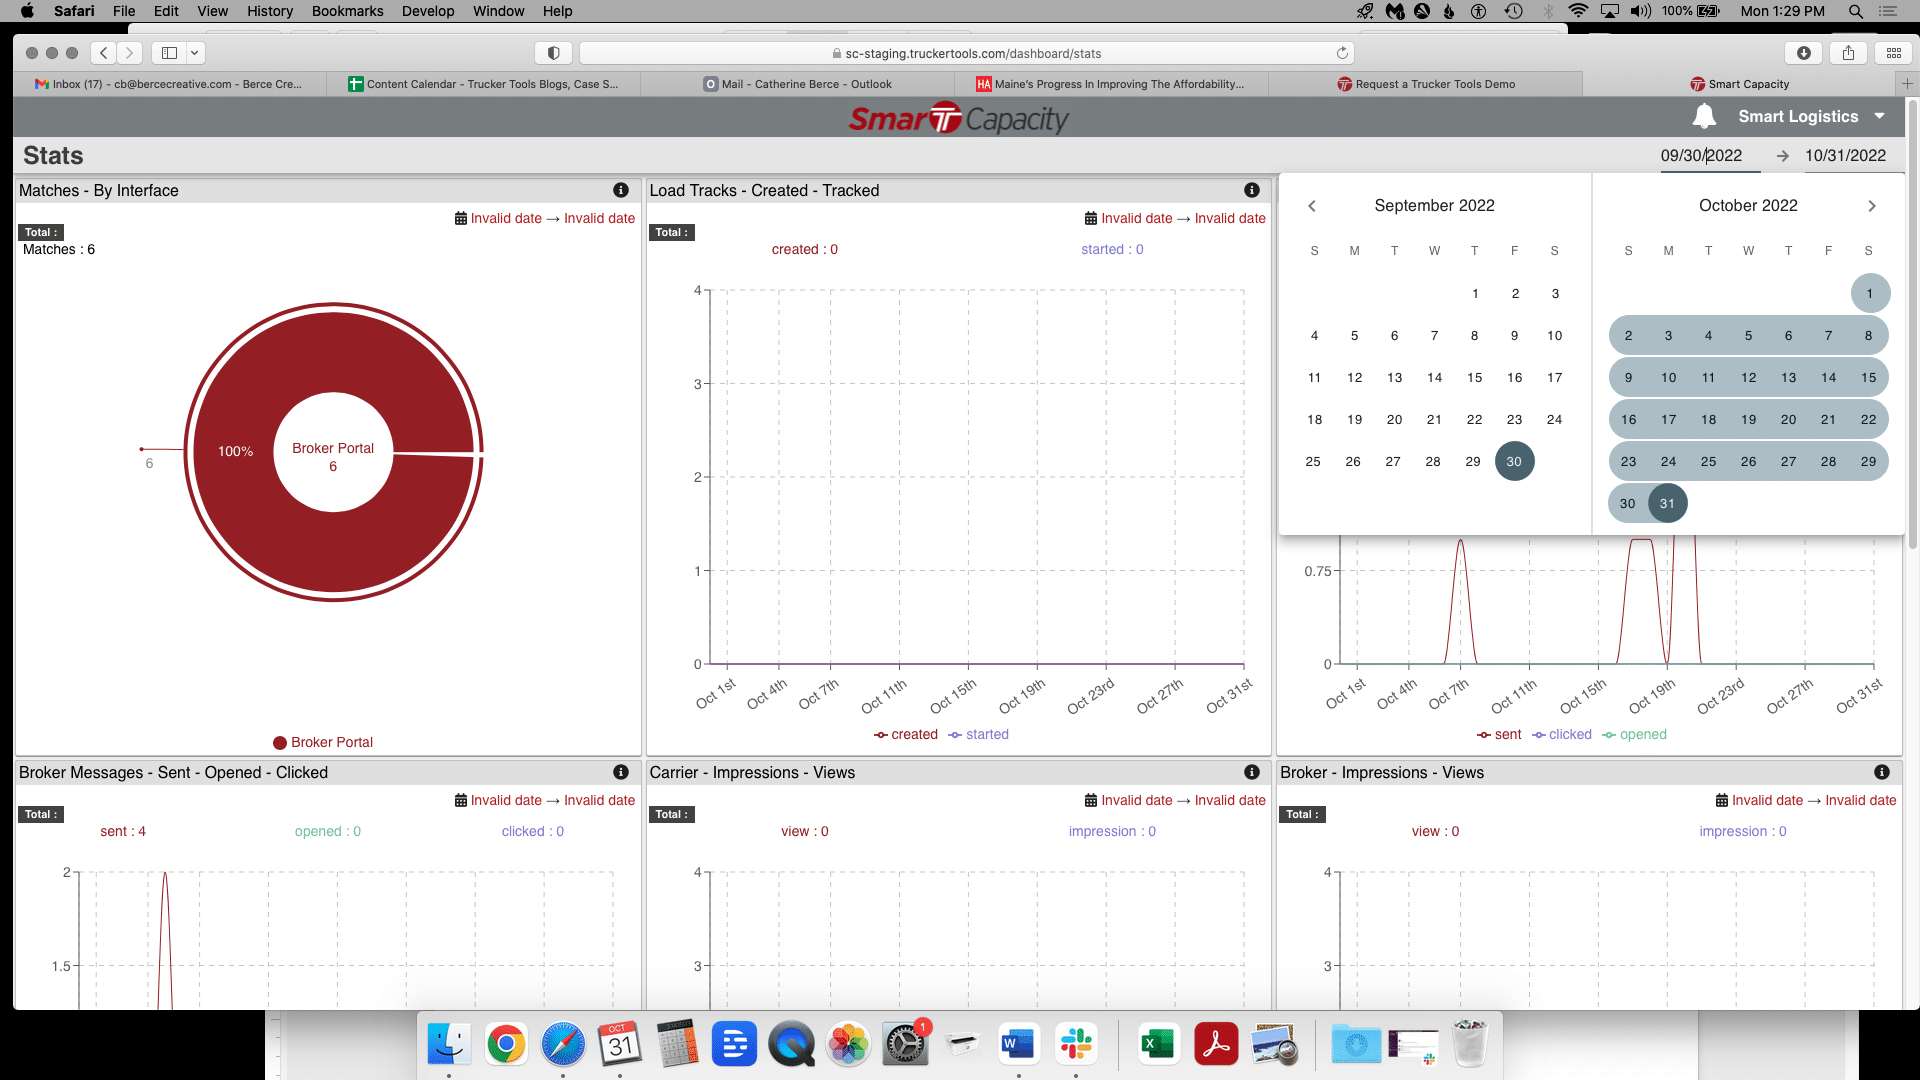
Next, choose the date range. In this example, we’re going with 01/01/2019 through 10/31/2022 to provide us with lots of data.
Step #3 — View Load Track Stats
In this example, we see that during this time period, 40,224 load tracks were created and 36,128 load tracks were started. Click on the i-button to learn more about what each stat means. Here, the i-button indicates that this graph shows you your load tracking success rate.
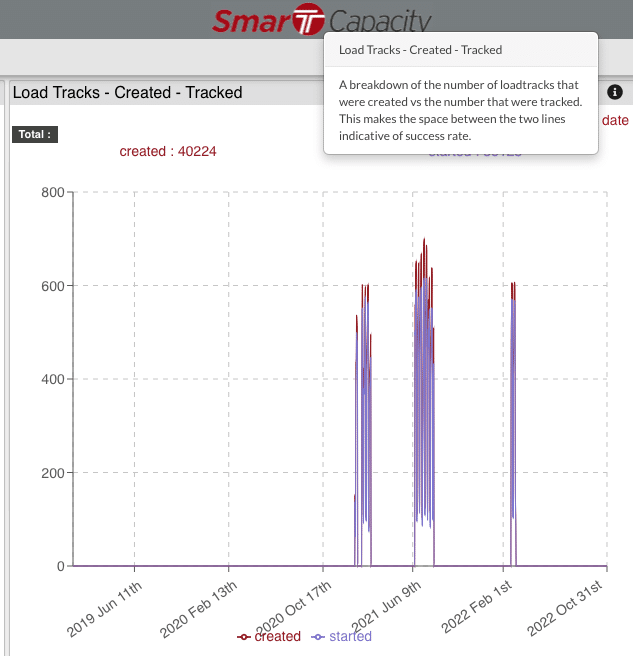
The fact that roughly 4,000 load tracks during this time period weren’t started may indicate that some additional driver education may be needed regarding how to start tracking a load with Trucker Tools’ driver app — or that some of your drivers may be interested in tracking via ELD.
Step #4 — View Carrier Messages Stats
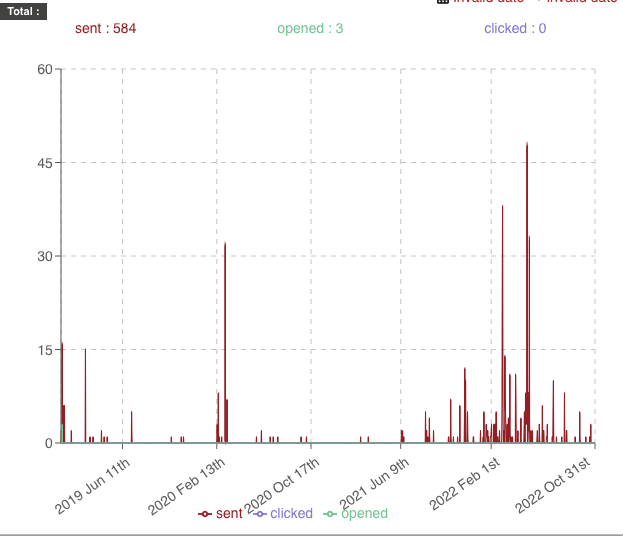
The next set of data within Smart Capacity’s Stats concerns Carrier Messages, i.e. the messages sent to you from carriers. As you see in this example’s graph, you received 584 carrier messages, but only opened three of them. That means your carrier response rate is extremely low and needs improvement! To better leverage Smart Capacity’s capabilities, consider opening and responding to carrier messages with higher frequency.
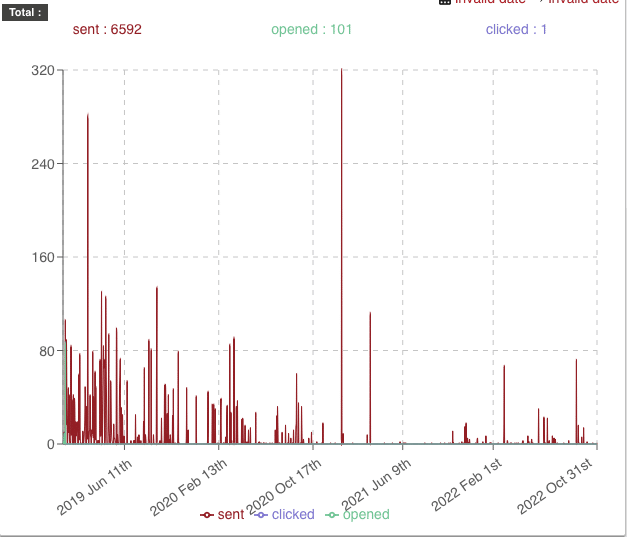
Step #5 — View Broker Messages Stats
This set of data is about the messages that you’ve sent to carriers and owner operators via Smart Capacity during this time period. Here you can see that we’ve sent 6,500+ messages to carriers and drivers with 101 of these messages opened. However, we only got one click during that time period, which may indicate that our best practices for communicating with carriers may need some work.
Step #7 — View Carrier Impressions, Broker Impressions, Broker Logins, Broker Actions, Unavailability Stats
You also can view stats on carrier impressions, broker impressions, broker logins, broker actions and unavailability to better understand how you and your team are using Smart Capacity.
If you’re a current Smart Capacity user and need some help understanding how to use Stats to improve your operations, reach out to your Customer Success Manager or [email protected].
Not a current Trucker Tools customer? Schedule a free demo of Smart Capacity.